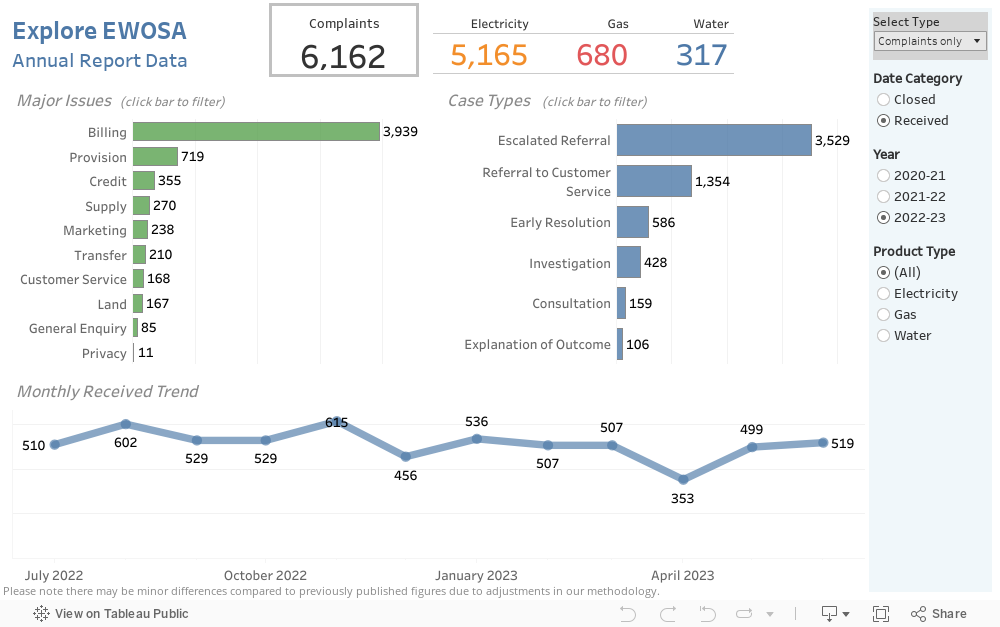
Explore EWOSA data insights using the below interactive data visualisations. You can click on the filters on the right side or upon coloured bars to help explore aspects of the data. These figures present a condensed format of what is published in our Annual Reports.
By default the figures below show complaints only, however you can also view all our cases which also includes enquiries we have received by clicking on the Select Type option. The figures provided are for information purposes only and the conditions experienced by energy and water suppliers can frequently change. You might find minor differences in previously published figures due to adjustments in our methodology over time.